Written by Rattle Web Solutions. This guide combines official performance guidance with a documented review of our own website. Original publication: May 10, 2026. Sources reviewed: October 11, 2026.
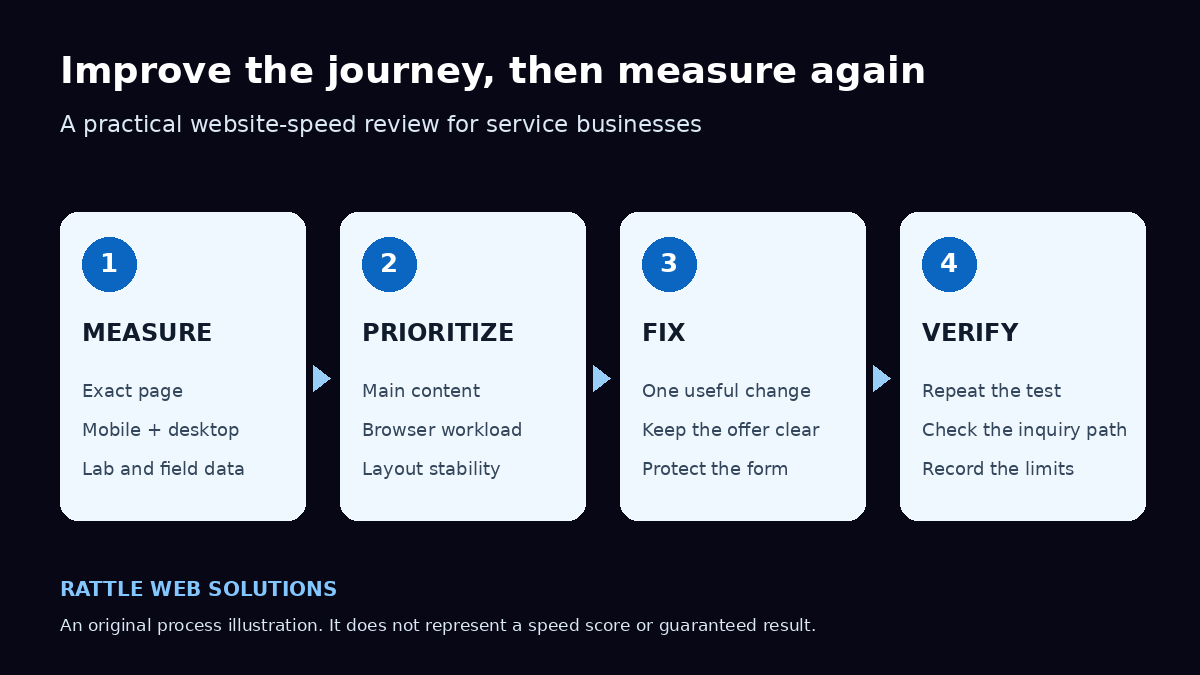
Separate lab findings from real-user experience
Lab data shows what happened in a simulated test. Field data shows measured experience from eligible real users. They answer different questions. Before acting on a screenshot, ask which type of evidence it contains.
| Evidence | Useful for | Important limit |
|---|---|---|
| Lighthouse lab test | Finding a likely bottleneck on a tested page. | One simulated run is not every visitor’s experience. |
| Chrome User Experience Report field data | Assessing real-user performance over a trailing 28-day period. | A page may lack sufficient eligible samples. Origin data can cover the wider site. |
Check the URL, device strategy, test date and data scope. If a report falls back from the page to the origin, label that clearly in your records. If it has no field assessment, say that it is unavailable rather than declaring a pass or failure. Google’s PageSpeed Insights documentation explains these distinctions.
Our recommendation for a small service business is to start with the page closest to a commercial decision: an ad landing page, a frequently visited service page or a contact page with a reported delay. Record what a visitor is trying to do there. That creates a more useful starting point than testing a convenient page and assuming it represents the entire website.
Understand LCP, INP and CLS
Core Web Vitals cover loading, interaction responsiveness and layout stability. The current metrics are Largest Contentful Paint, Interaction to Next Paint and Cumulative Layout Shift.
| Metric | Visitor experience | Good threshold |
|---|---|---|
| LCP | When the largest visible content appears. | 2.5 seconds or less |
| INP | How promptly the page responds to interaction. | 200 milliseconds or less |
| CLS | How much visible content shifts unexpectedly. | 0.1 or less |
Assess field values at the 75th percentile, separately for mobile and desktop. These thresholds are experience targets, not promises of sales or a particular search position. Source: Google’s Web Vitals overview.
Total Blocking Time, or TBT, is a lab diagnostic that can flag heavy browser work during loading. It is not the same measurement as INP. A low TBT does not prove that every menu, form or accordion responds well later. See Google’s TBT explanation; test the interactions that matter to your buyers as well.
Choose a useful first fix
Start with the issue supported by the strongest evidence for the affected page. Treat a list of opportunities as an investigation queue, then connect each proposed change to a visible problem.
Make the main content available sooner
Locate the reported LCP element before assuming the hero image is responsible. It could be an image or a text block. Check whether an oversized file, a delayed request or blocking page resources are keeping that element from appearing. Use an appropriately sized image and suitable compression, and review its loading priority. An essential first-screen image should not automatically be lazy-loaded.
Ask your implementer to show the identified element, the evidence and the proposed fix. Avoid a blanket instruction to preload every image or replace every format. Google’s LCP optimization guide explains the investigation in more detail.
Remove work the page does not need
Review what each plugin, embed and script contributes. A feature used on one page does not necessarily belong on every page. Identify optional functionality before removing anything that supports a form, navigation, consent or measurement.
For example, a service-page owner may decide that a static client-logo strip communicates the same proof as a moving carousel. That is a design decision worth evaluating. It is not a reason to uninstall an entire builder that other sections depend on. Document the specific feature removed and check the rest of the page after the change.
Keep interactions and layout predictable
Reserve space for images and embedded forms. Check whether banners or fonts move the action while a visitor is about to use it. Use a keyboard to open the menu, move through the form and activate the main button. Review loading, validation and error messages as well as the finished layout.
The official INP guide and CLS guide explain the relevant technical investigations. For the business review, describe the actual symptom: “the button moves while I tap it” is more actionable than “the page feels bad.”
Review delivery settings with a recovery path
If caching, redirects or delivery settings need work, have the responsible implementer review them in the site’s actual hosting setup. Record the existing setting and prepare a way to reverse a change. Inspect the actual redirect chain before changing rules. An estimated saving in a report does not reveal which rule should be removed.
Our implementation recommendation is to make one bounded change at a time. Keep a backup, identify the affected pages and test the published version. That makes a problem easier to diagnose if an optimization conflicts with another part of the site.
Protect the buyer’s inquiry journey
A performance change succeeds only if visitors can still understand the service and complete the intended action. Keep useful scope, proof and contact guidance while removing unnecessary work.
Test the full path: service page, CTA, form, confirmation and receipt in the agreed destination. Distinguish a button click from a delivered inquiry. Keep controlled test submissions identifiable so they are not counted as genuine leads. Where relevant, check that agreed conversion tracking still records the intended event.
A quicker page cannot create demand that does not exist. Inquiries also depend on market fit, visitor intent, your offer, price, trust and follow-up. If traffic is arriving but useful inquiries are scarce, review the broader website conversion journey alongside the performance issue.
Google recommends looking at overall page experience rather than chasing one score. Its page-experience guidance covers mobile usability and other considerations; good performance alone does not guarantee a top ranking.
A real example: less gallery code, mixed speed results
Removing unnecessary code is an observable result. A sustained improvement for real visitors requires further evidence. Our homepage review on October 11, 2026 illustrates the difference.
We replaced a continuously moving carousel with a static responsive strip. All seven client logos remained in the original order. The gallery had rendered 21 image instances, including repeated logos; the replacement rendered seven. Five gallery-related script files no longer appeared in the published homepage’s script list. Images received meaningful brand-specific alt text and explicit dimensions.
| Metric | Before | After |
|---|---|---|
| LCP | 2.7 seconds | 3.0 seconds |
| TBT | 119 milliseconds | 393 milliseconds |
| CLS | 0.018 | 0.018 |
The lab measurements were mixed, despite the confirmed reduction in gallery code. We did not describe this as an overall speed improvement. The domain report returned no field data or INP, and did not identify its exact tested URL or redirect chain. It cannot certify the homepage’s real-user experience or attribute the changes in timing to the logo replacement.
Method: one forced-fresh desktop/mobile domain audit before and one after; published homepage DOM comparison; desktop layout check and native WordPress mobile/tablet previews. These previews were not physical-device tests. The figures describe this checkpoint, not a general benchmark or a promised client outcome.
This is the evidence standard we recommend requesting from a website partner: show what changed, explain what was measured and identify what remains unknown.
Compare changes fairly
Use comparable tests, check the published page and keep uncertainty visible. A before-and-after screenshot is a useful record, but it is not sufficient proof of a lasting improvement.
Keep a short change log with the URL, date, device strategy, tool, cache state where known, field-data scope, relevant metric and completed change. Repeat comparable lab tests and inspect the range rather than selecting only the best result. Where field data is available, follow its trend while recognizing that the collection window contains older visits too.
Then check the business journey separately. Has the form remained reliable? Are received inquiries relevant? Has the sales response changed? Use consistent definitions for an inquiry and a qualified lead. Avoid claiming that a speed edit caused more customers without evidence that addresses other changes.
A release checklist for your website partner
- Scope: name the exact page, visitor action, observed problem and rollback source.
- Baseline: label lab versus field evidence, mobile versus desktop and page versus origin.
- Change: explain which asset, feature or setting was changed and why.
- Content: preserve the offer, important proof, accessible text and contact instructions.
- Usability: check narrow layouts, keyboard use, buttons, menus and form states.
- Receipt: verify the test inquiry reaches its intended destination; keep it separate from real leads.
- Retest: record comparable results and remaining issues, including missing field data.
Choose website support around the problem
Rattle can review a service page’s content, responsive layout, assets and contact journey, then agree a practical scope. Our WordPress website work uses a template-based Astra and Spectra approach with defined page scope and limited customization. It should be evaluated against your needs rather than described as a bespoke build.
Share the affected URL, the action that feels slow, the devices involved and any dated reports you have. We can separate a demonstrated issue from an assumption before proposing work. Hosting, integrations and additional changes are reviewed as part of the agreed scope.
Frequently asked questions
Is a 100 PageSpeed score necessary?
No. Treat the score as a diagnostic. Your buyer needs readable content, usable controls and a reliable inquiry path. A perfect lab score is not proof of a good real-user experience.
Which speed problem should a small business fix first?
Start with a demonstrated bottleneck on a page important to buyers. Identify the delayed content or interaction, propose a bounded change and verify the full journey afterward.
Why do mobile and desktop reports differ?
They use different simulated environments. Compare mobile with mobile and desktop with desktop, and record the configuration. Do not use a strong desktop result to dismiss a mobile problem.
Can I use TBT as my INP result?
No. TBT can suggest responsiveness issues during a lab test, but it does not replace field INP. Test actual interactions and report missing INP evidence honestly.
Why is real-user data missing?
The page or origin may lack sufficient eligible samples. Missing field data does not prove good or poor performance. Use lab investigation and direct journey testing while keeping that limit visible.
Should every website image be lazy-loaded?
No. Review an image’s role and position. Delaying an essential first-screen image can be counterproductive; offscreen images may be suitable for lazy loading. Reserve image dimensions either way.
Do I need to rebuild my entire website?
Not automatically. A specific image, script, layout or inquiry-path fix may be enough. Decide after diagnosing the problem and reviewing your content and business requirements.
Does website speed guarantee Google or AI-search visibility?
No. Speed is one part of page experience. Google says its AI search features use existing SEO foundations and require no special AI schema. Relevant, accessible content and eligibility matter, but inclusion is not guaranteed. See Google’s AI-features guidance.
How soon should I retest a performance change?
Check the published version and its inquiry journey after release. Repeat comparable lab tests. Review field trends over time when enough data exists; do not promise a fixed timeline from one sample.
Will a faster page generate better leads?
It may remove a usability obstacle, but lead quality also depends on demand, market fit, visitor intent, the offer and sales follow-up. Measure received inquiries and qualification separately from speed.
Sources and method
This guide uses primary documentation, reviewed October 11, 2026. Thresholds and tool definitions may change; refer to the linked guidance when implementing a fix. The homepage example is Rattle’s own dated observation and is separate from Google’s general recommendations.
- Google: About PageSpeed Insights — lab/field evidence and data availability.
- Google: Web Vitals — LCP, INP and CLS definitions and good thresholds.
- Google: Total Blocking Time — the lab metric and its limits as an INP proxy.
- Optimize LCP, optimize INP and optimize CLS — technical investigation guidance.
- Google Search Central: Page experience and AI features and your website — eligibility and limits of optimization claims.